📊 Dashboards
Dashboards let you visualize sensor data at a glance and, more importantly, evaluate how effective your cooling setup is over time.
You can create multiple dashboards with different filters to focus on specific components (CPU, GPU, case), time spans, or device groups. Dashboards support filtering by Tags so you can quickly scope a view to a logical group of channels without selecting each one manually.
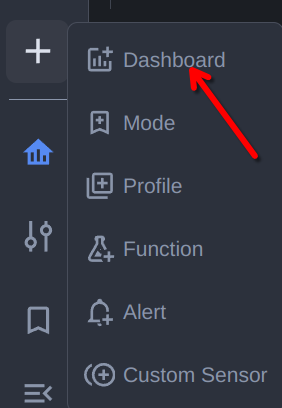
Use the Create Dashboard quick link to add a new dashboard:
There are three dashboard types, each with their own filters:
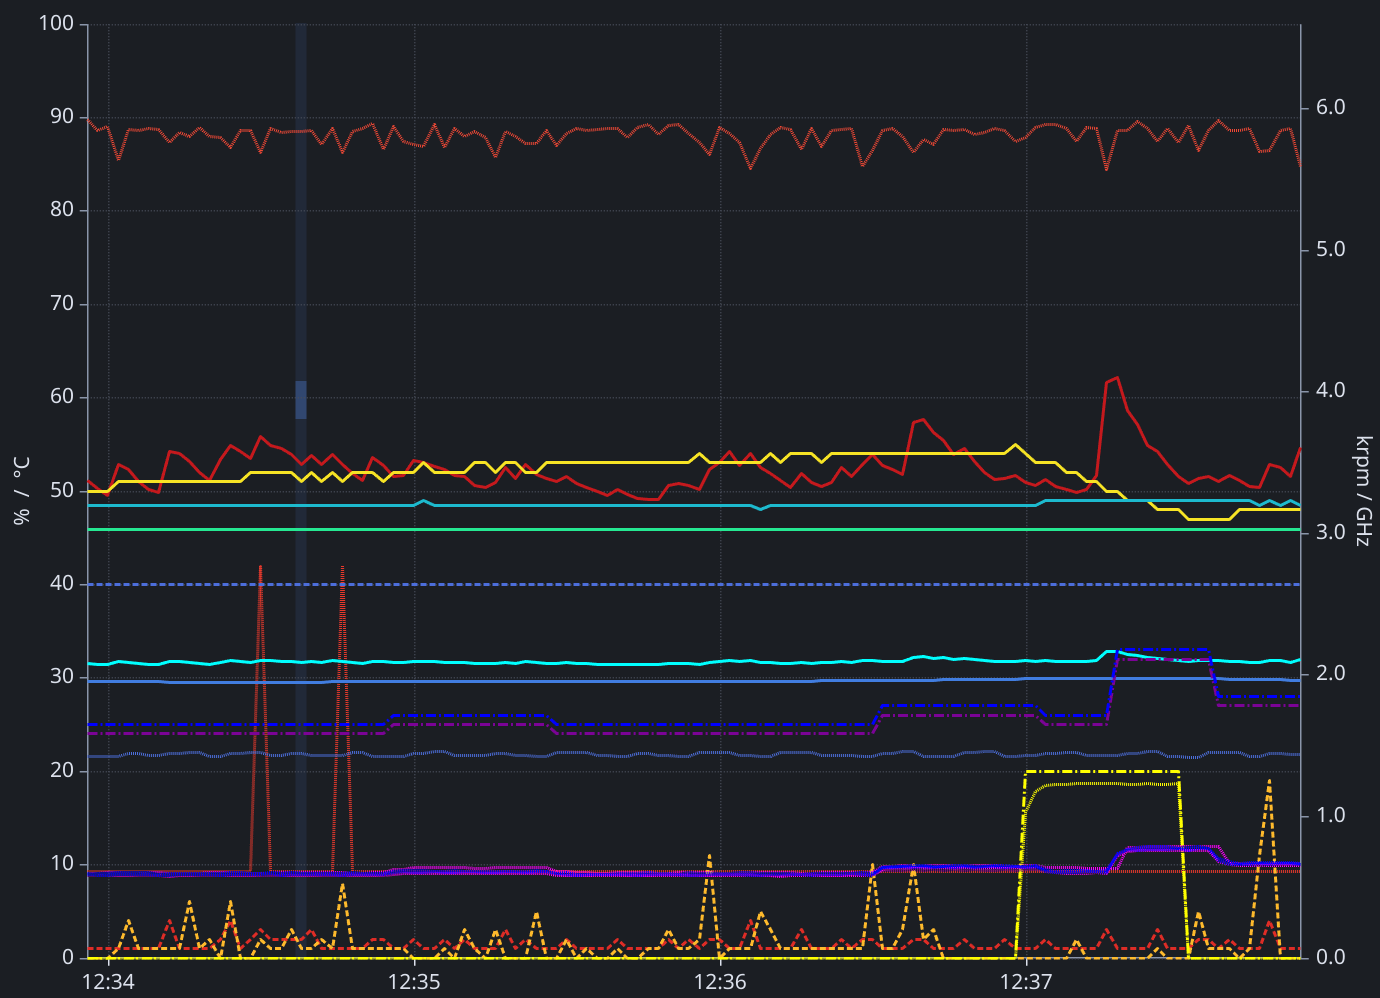
Time Chart
Real‑time charts for temperatures, fan speeds, power, etc. Adjust the time window, series visibility, and smoothing to spot trends and correlations.
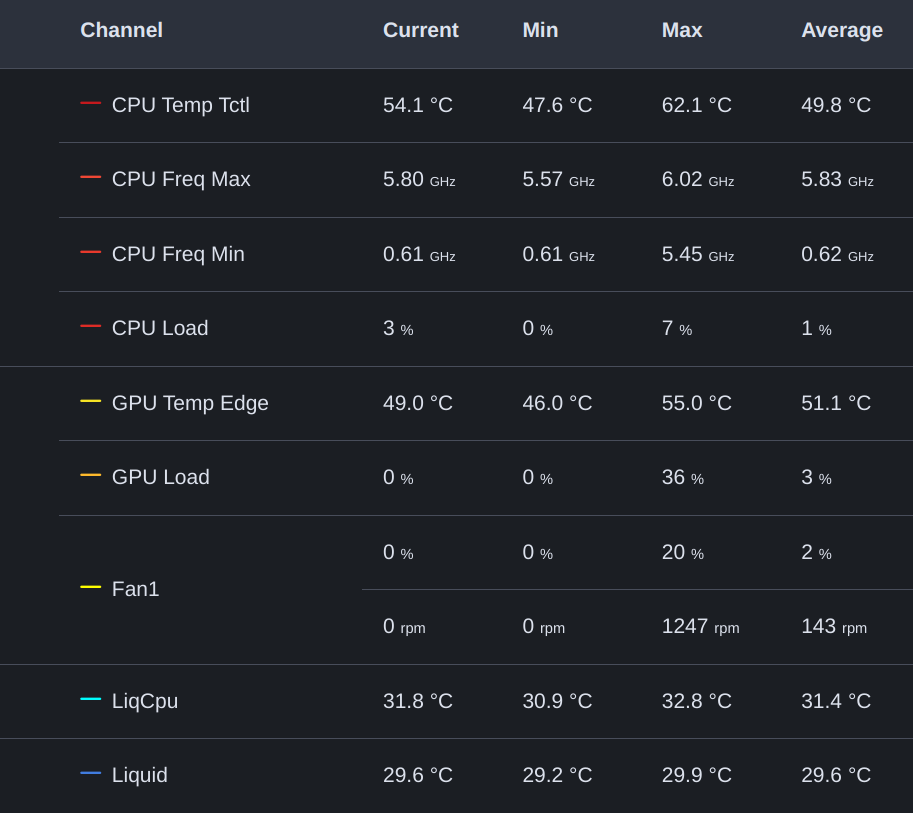
Table
A real‑time table with filtering and summary stats. Great for precise values, sorting, and quick comparisons.
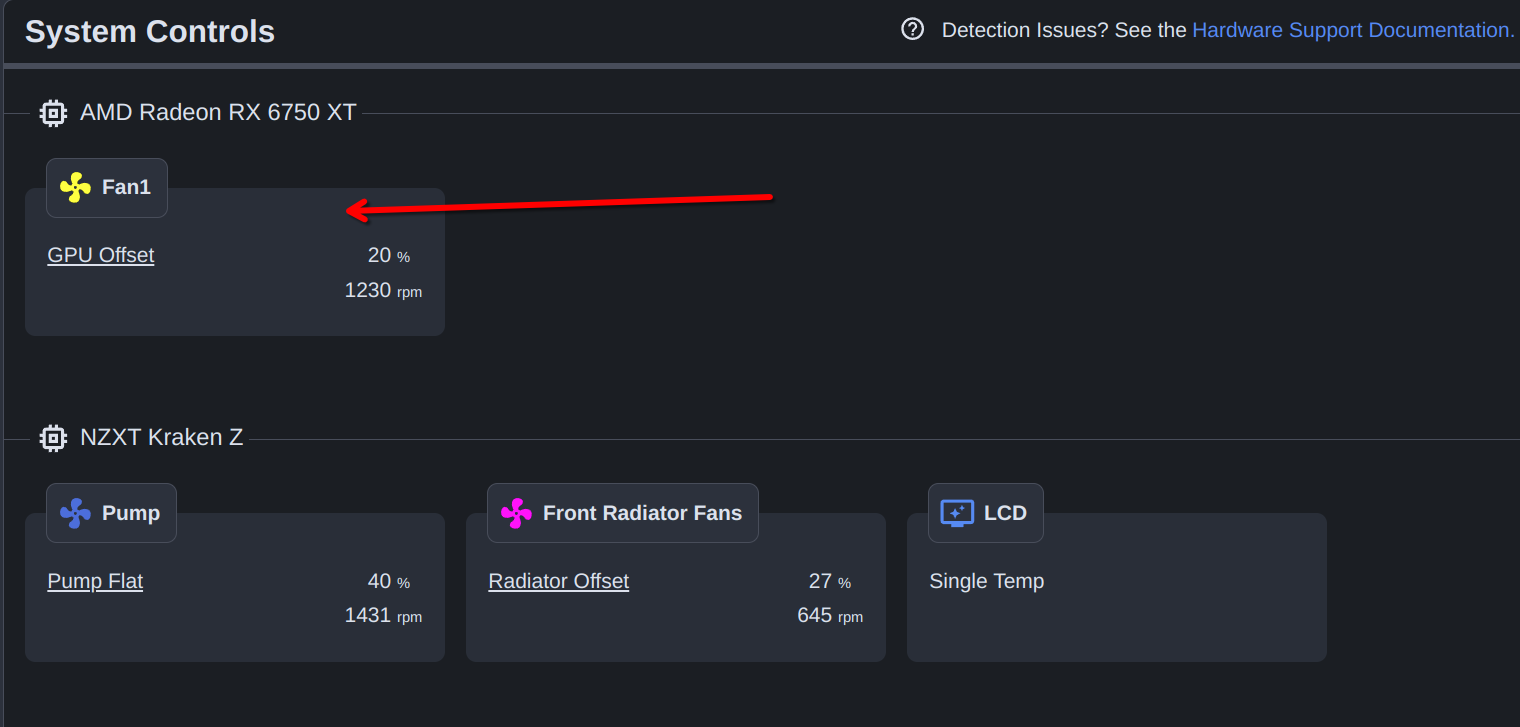
Controls
A filtered list of controllable channels (fans, pumps, LEDs) with their current state. Jump directly to configuration from here when you spot something to adjust.
See Also
- Alerts - Get notified when sensor conditions are met
- Controls - Adjust fan settings when you spot something in a dashboard
- Tags - Organize channels and filter dashboards by group
- Custom Sensors - Add computed sensors to your dashboards